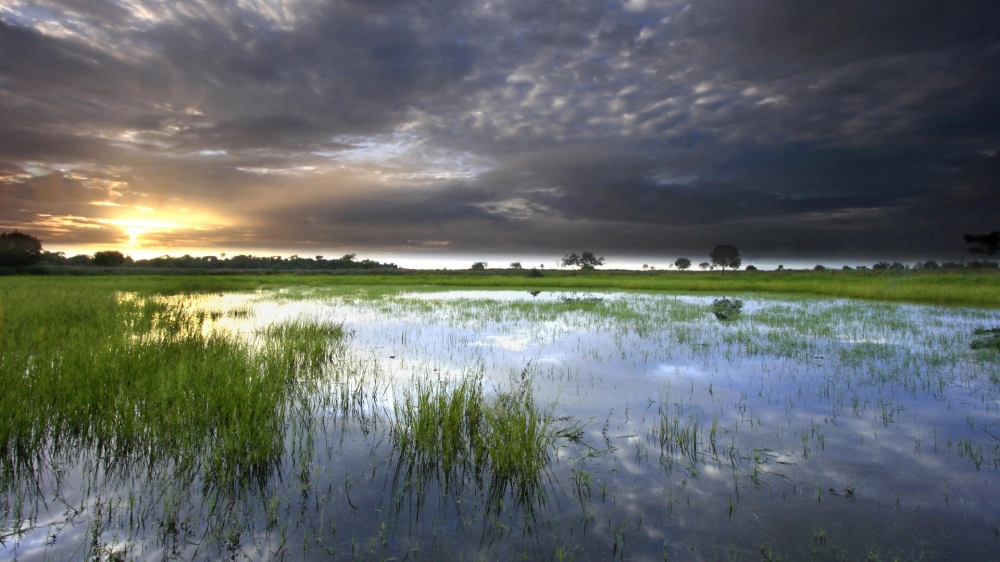
先上原圖:

下面是程序:
rgb = imread('你圖片文件');%讀取原圖像I = rgb2gray(rgb);%轉(zhuǎn)化為灰度圖像figure; subplot(121)%顯示灰度圖像imshow(I)text(732,501,'Image courtesy of Corel',... 'FontSize',7,'HorizontalAlignment','right')hy = fspecial('sobel');%sobel算子hx = hy';Iy = imfilter(double(I), hy, 'replicate');%濾波求y方向邊緣Ix = imfilter(double(I), hx, 'replicate');%濾波求x方向邊緣gradmag = sqrt(Ix.^2 + Iy.^2);%求摸subplot(122); imshow(gradmag,[]), %顯示梯度title('Gradient magnitude (gradmag)')L = watershed(gradmag);%直接應(yīng)用分水嶺算法Lrgb = label2rgb(L);%轉(zhuǎn)化為彩色圖像figure; imshow(Lrgb), %顯示分割后的圖像title('Watershed transform of gradient magnitude (Lrgb)')se = strel('disk', 20);%圓形結(jié)構(gòu)元素Io = imopen(I, se);%形態(tài)學(xué)開操作figure; subplot(121)imshow(Io), %顯示執(zhí)行開操作后的圖像title('Opening (Io)')Ie = imerode(I, se);%對(duì)圖像進(jìn)行腐蝕Iobr = imreconstruct(Ie, I);%形態(tài)學(xué)重建subplot(122); imshow(Iobr), %顯示重建后的圖像title('Opening-by-reconstruction (Iobr)')Ioc = imclose(Io, se);%形態(tài)學(xué)關(guān)操作figure; subplot(121)imshow(Ioc), %顯示關(guān)操作后的圖像title('Opening-closing (Ioc)')Iobrd = imdilate(Iobr, se);%對(duì)圖像進(jìn)行膨脹Iobrcbr = imreconstruct(imcomplement(Iobrd), ... imcomplement(Iobr));%形態(tài)學(xué)重建Iobrcbr = imcomplement(Iobrcbr);%圖像求反subplot(122); imshow(Iobrcbr), %顯示重建求反后的圖像title('Opening-closing by reconstruction (Iobrcbr)')fgm = imregionalmax(Iobrcbr);%局部極大值figure; imshow(fgm), %顯示重建后局部極大值圖像title('Regional maxima of opening-closing by reconstruction (fgm)')I2 = I;I2(fgm) = 255;%局部極大值處像素值設(shè)為255figure; imshow(I2), %在原圖上顯示極大值區(qū)域title('Regional maxima superimposed on original image (I2)')se2 = strel(ones(5,5));%結(jié)構(gòu)元素fgm2 = imclose(fgm, se2);%關(guān)操作fgm3 = imerode(fgm2, se2);%腐蝕fgm4 = bwareaopen(fgm3, 20);%開操作I3 = I;I3(fgm4) = 255;%前景處設(shè)置為255figure; subplot(121)imshow(I3)%顯示修改后的極大值區(qū)域title('Modified regional maxima')bw = im2bw(Iobrcbr, graythresh(Iobrcbr));%轉(zhuǎn)化為二值圖像subplot(122); imshow(bw), %顯示二值圖像title('Thresholded opening-closing by reconstruction')D = bwdist(bw);%計(jì)算距離DL = watershed(D);%分水嶺變換bgm = DL == 0;%求取分割邊界figure; imshow(bgm), %顯示分割后的邊界title('Watershed ridge lines (bgm)')gradmag2 = imimposemin(gradmag, bgm | fgm4);%置最小值L = watershed(gradmag2);%分水嶺變換I4 = I;I4(imdilate(L == 0, ones(3, 3)) | bgm | fgm4) = 255;%前景及邊界處置255figure; subplot(121)imshow(I4)%突出前景及邊界title('Markers and object boundaries')Lrgb = label2rgb(L, 'jet', 'w', 'shuffle');%轉(zhuǎn)化為偽彩色圖像subplot(122); imshow(Lrgb)%顯示偽彩色圖像title('Colored watershed label matrix')figure; imshow(I), hold onhimage = imshow(Lrgb);%在原圖上顯示偽彩色圖像set(himage, 'AlphaData', 0.3);title('Lrgb superimposed transparently on original image')
最后得到一個(gè)清晰的海岸線圖像:
新聞熱點(diǎn)


疑難解答
圖片精選
網(wǎng)友關(guān)注