上篇《基于WebForm+EasyUI的業務管理系統形成之旅 -- 數據統計》,主要介紹系統數據統計所采用圖形、報表工具。
本篇將如何構建Web界面以及新增、編輯、導出數據等功能。
一、在Web界面使用ParamQueryGrid控件
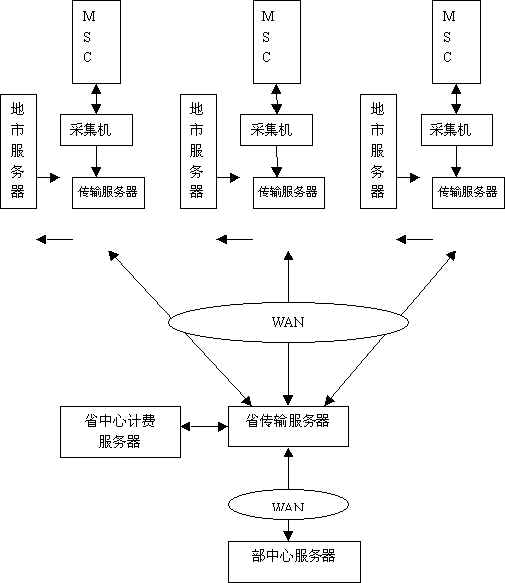
web界面,如圖所示

新增、編輯功能就不詳細講了,看一下導出功能

通過選擇導出列,選擇導出內容
1 Dictionary<string, string> dic = new Dictionary<string, string>(); 2 for (int i = 0; i < cblColumns.Items.Count; i++) 3 { 4 if (cblColumns.Items[i].Selected) 5 { 6 dic.Add(cblColumns.Items[i].Value, cblColumns.Items[i].Text); 7 } 8 } 9 if (dic.Count == 0)10 {11 ShowMsgHelper.Alert("請選擇需要導出的數據列!");12 }13 else14 {15 //ShowMsgHelper.AlertMsg("導出成功!");16 StringBuilder strSql = new StringBuilder();17 strSql.AppendFormat("SELECT * FROM {0}", _key);18 DataTable dt = DataFactory.SqlDbHelper.GetDataTableBySQL(strSql);19 if (dt != null && dt.Rows.Count > 0)20 {21 //string path = new DataToExcel().DataExcel(dt, _fileName, Server.MapPath(YYCKeys.FILE_EXPORT_ADDRESS), dic);22 //new InsusIOUtility().Download(Server.MapPath(YYCKeys.FILE_EXPORT_ADDRESS) + "http://" + path, _fileName + ".xls");23 if (YYC.Common.DotNetUI.ExcelHelper.ExportExcel(dt, dic, _fileName))24 {25 ShowMsgHelper.AlertMsg("導出成功!");26 }27 }28 }新聞熱點


疑難解答