Python調用Matplotlib代碼繪制分布點,供大家參考,具體內容如下
繪制點圖的目的 Matplotlib簡介 代碼 截圖1.繪制點圖的目的
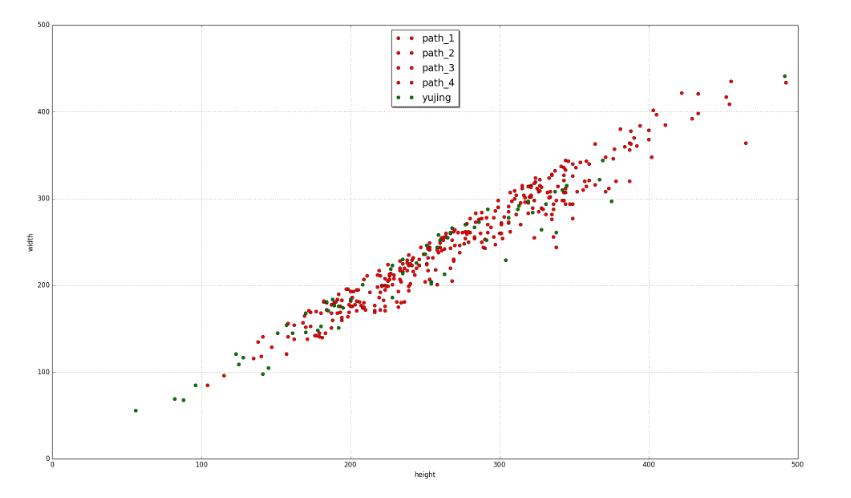
我們實驗室正在做關于人臉識別的項目,其中在人臉檢測后,會有些誤檢的圖片,但是其中就有很多不符合的。很明顯的是從圖片大小,就可以過濾掉一部分。老大交給我的工作,就是通過繪制圖片width,height的分布圖,來找到一個合理的閾值。
2.Matlablib簡介
Matplotlib是一個Python的圖形框架
下面是官網的例子
Matplotlib example
3.代碼如下
import matplotlib.pyplot as pltfrom numpy.random import randimport numpyimport osimport cv2#setting pltplt.xlim(xmax=500,xmin=0)plt.ylim(ymax=500,ymin=0)plt.xlabel("height")plt.ylabel("width")path_1 = r'D:/zhangjichao/view/path_1'x = []y = []files = os.listdir(path_1)for f in files: img = cv2.imread(path_1 + '//' + f) x.append(img.shape[0]) y.append(img.shape[1])plt.plot(x,y,'ro',color='red',label='path_1')path_2 = r'D:/zhangjichao/view/path_2'x = []y = []files = os.listdir(path_2)for f in files: img = cv2.imread(path_2 + '//' + f) x.append(img.shape[0]) y.append(img.shape[1])plt.plot(x,y,'ro',color='red',label='path_2')path_3 = r'D:/zhangjichao/view/path_3'x = []y = []files = os.listdir(path_3)for f in files: img = cv2.imread(path_3 + '//' + f) x.append(img.shape[0]) y.append(img.shape[1])plt.plot(x,y,'ro',color='red',label='path_3')path_4 = r'D:/zhangjichao/view/path_4'x = []y = []files = os.listdir(path_4)for f in files: img = cv2.imread(path_4 + '//' + f) x.append(img.shape[0]) y.append(img.shape[1])plt.plot(x,y,'ro',color='red',label='path_4')yujing = r'D:/zhangjichao/view/xujing'x = []y = []files = os.listdir(yujing)for f in files: img = cv2.imread(yujing + '//' + f) x.append(img.shape[0]) y.append(img.shape[1])plt.plot(x,y,'ro',color='green' , label='yujing')#圖例plt.legend(loc='upper center', shadow=True, fontsize='x-large')plt.grid(True)#顯示plt.show()4.顯示結果
以上就是本文的全部內容,希望對大家的學習有所幫助,也希望大家多多支持武林網之家。
新聞熱點


疑難解答