本文實例為大家分享了python機器學習實現決策樹的具體代碼,供大家參考,具體內容如下
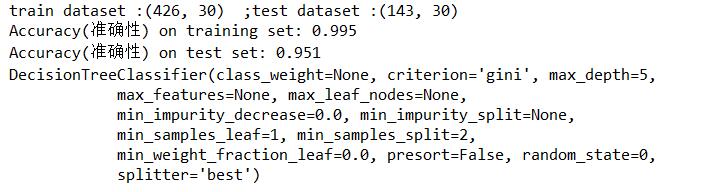
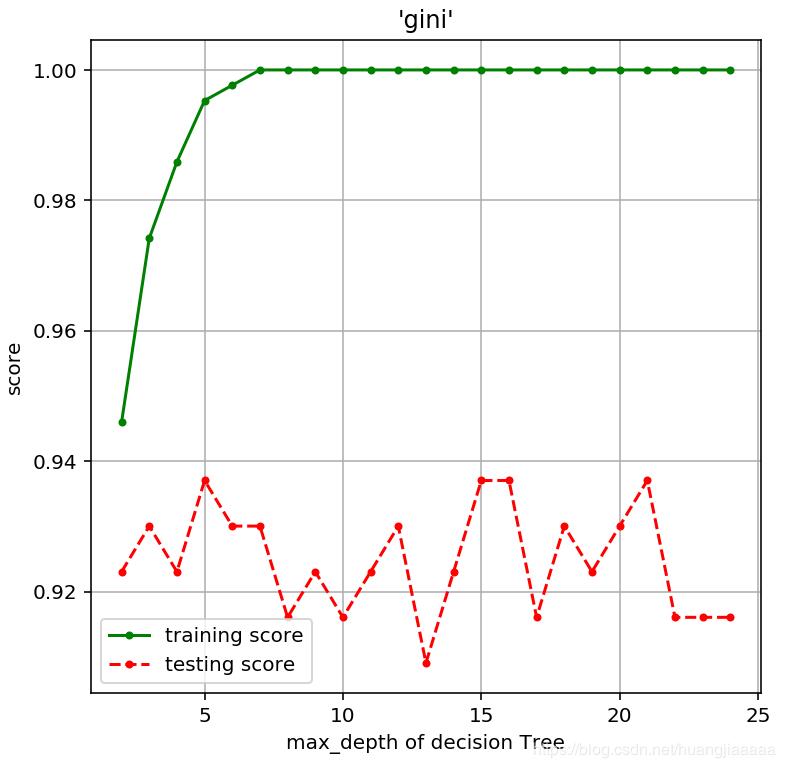
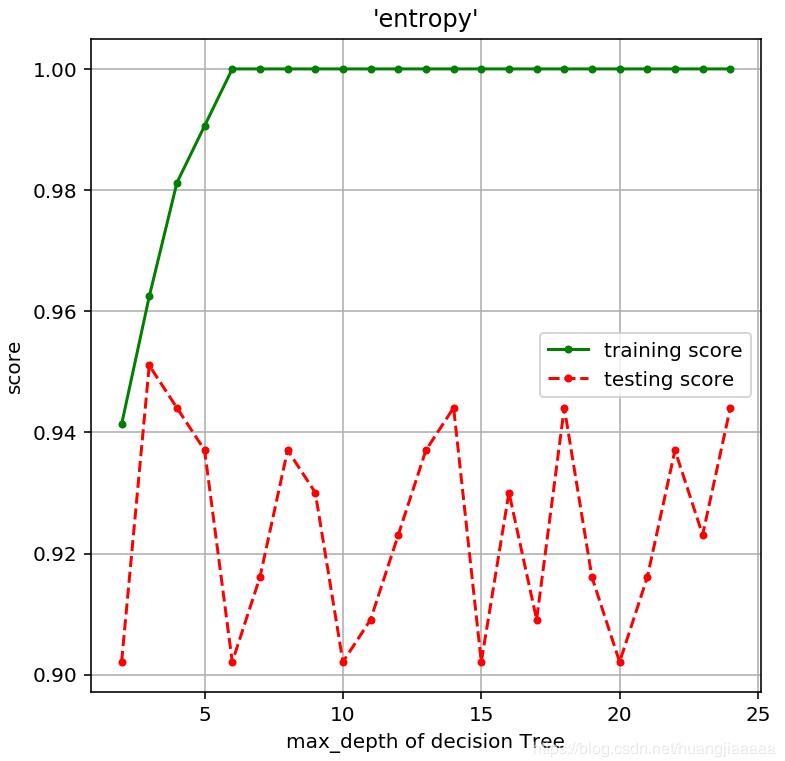
# -*- coding: utf-8 -*-"""Created on Sat Nov 9 10:42:38 2019@author: asus""""""決策樹目的:1. 使用決策樹模型2. 了解決策樹模型的參數3. 初步了解調參數要求:基于乳腺癌數據集完成以下任務:1.調整參數criterion,使用不同算法信息熵(entropy)和基尼不純度算法(gini)2.調整max_depth參數值,查看不同的精度3.根據參數criterion和max_depth得出你初步的結論。"""import matplotlib.pyplot as pltimport numpy as npimport pandas as pdimport mglearn from sklearn.model_selection import train_test_split#導入乳腺癌數據集from sklearn.datasets import load_breast_cancerfrom sklearn.tree import DecisionTreeClassifier#決策樹并非深度越大越好,考慮過擬合的問題#mglearn.plots.plot_animal_tree()#mglearn.plots.plot_tree_progressive()#獲取數據集cancer = load_breast_cancer()#對數據集進行切片X_train,X_test,y_train,y_test = train_test_split(cancer.data,cancer.target, stratify = cancer.target,random_state = 42)#查看訓練集和測試集數據 print('train dataset :{0} ;test dataset :{1}'.format(X_train.shape,X_test.shape))#建立模型(基尼不純度算法(gini)),使用不同最大深度和隨機狀態和不同的算法看模型評分tree = DecisionTreeClassifier(random_state = 0,criterion = 'gini',max_depth = 5)#訓練模型tree.fit(X_train,y_train)#評估模型print("Accuracy(準確性) on training set: {:.3f}".format(tree.score(X_train, y_train)))print("Accuracy(準確性) on test set: {:.3f}".format(tree.score(X_test, y_test)))print(tree)# 參數選擇 max_depth,算法選擇基尼不純度算法(gini) or 信息熵(entropy)def Tree_score(depth = 3,criterion = 'entropy'): """ 參數為max_depth(默認為3)和criterion(默認為信息熵entropy), 函數返回模型的訓練精度和測試精度 """ tree = DecisionTreeClassifier(criterion = criterion,max_depth = depth) tree.fit(X_train,y_train) train_score = tree.score(X_train, y_train) test_score = tree.score(X_test, y_test) return (train_score,test_score)#gini算法,深度對模型精度的影響depths = range(2,25)#考慮到數據集有30個屬性scores = [Tree_score(d,'gini') for d in depths]train_scores = [s[0] for s in scores]test_scores = [s[1] for s in scores]plt.figure(figsize = (6,6),dpi = 144)plt.grid()plt.xlabel("max_depth of decision Tree")plt.ylabel("score")plt.title("'gini'")plt.plot(depths,train_scores,'.g-',label = 'training score')plt.plot(depths,test_scores,'.r--',label = 'testing score')plt.legend()#信息熵(entropy),深度對模型精度的影響scores = [Tree_score(d) for d in depths]train_scores = [s[0] for s in scores]test_scores = [s[1] for s in scores]plt.figure(figsize = (6,6),dpi = 144)plt.grid()plt.xlabel("max_depth of decision Tree")plt.ylabel("score")plt.title("'entropy'")plt.plot(depths,train_scores,'.g-',label = 'training score')plt.plot(depths,test_scores,'.r--',label = 'testing score')plt.legend()運行結果:
新聞熱點


疑難解答